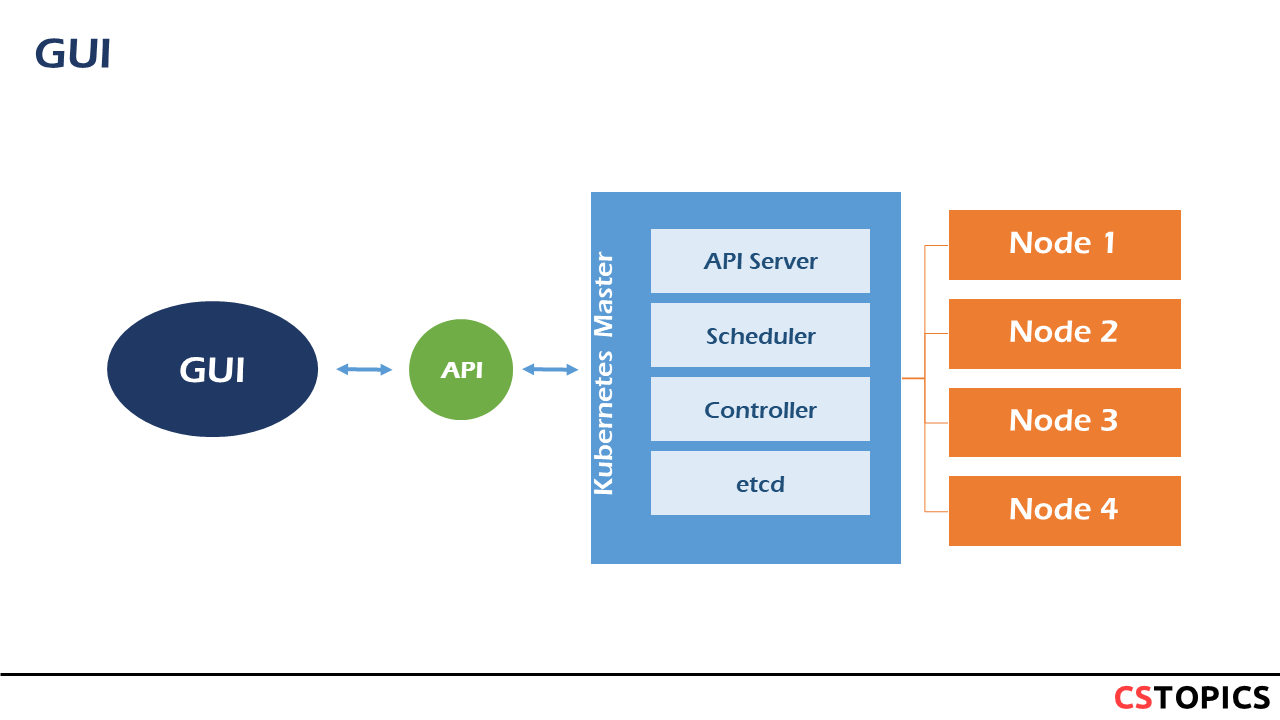
GUI
GUI clients
There are several user interfaces for Kubernetes. Some of the most famous are listed below:
- Kubernetes Dashboard - most mature and popular
- Lens - most powerful one
- Octant - easy to install and most portable
- kubenav - Android and iOS support
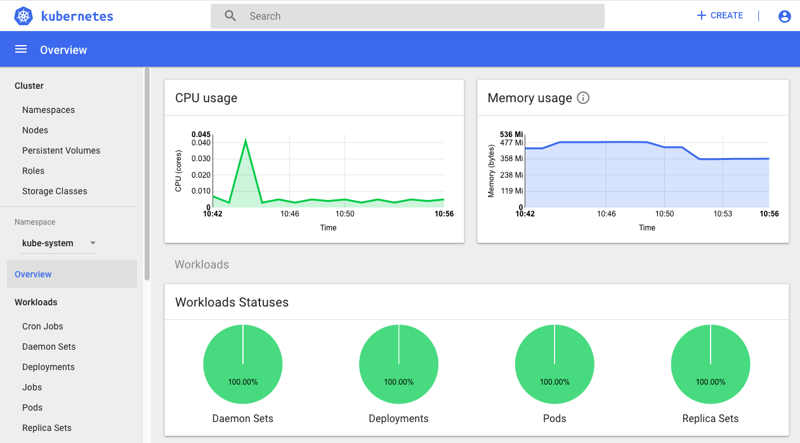
Kubernetes Dashboard
Kubernetes Dashboard is a general purpose, web-based UI for Kubernetes clusters.
It allows users to manage applications running in the cluster and troubleshoot them, as well as manage the cluster itself.
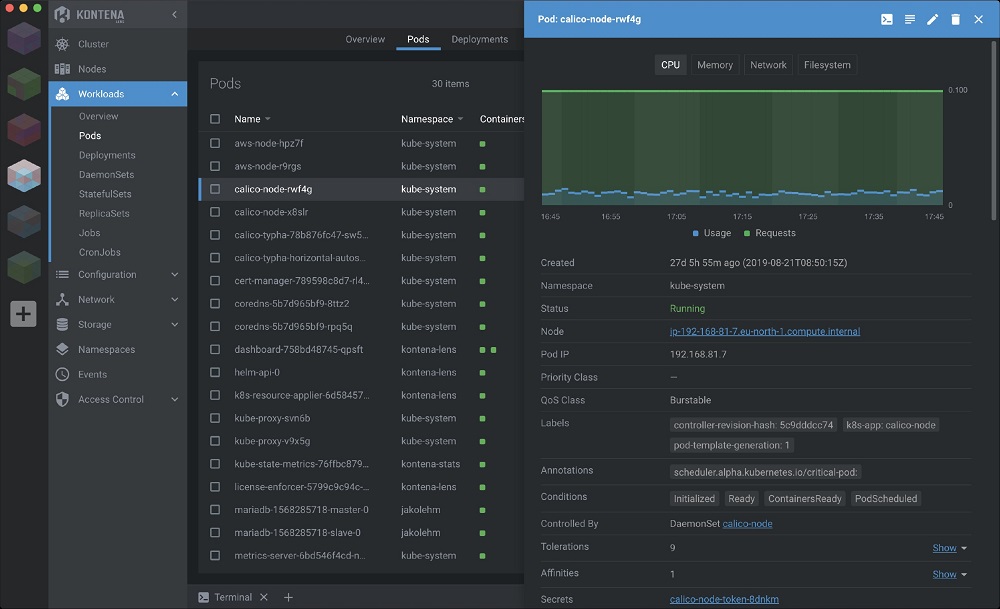
Lens
Lens is the most powerful Kubernetes IDE on the market. It is a standalone application, and it is available on macOS, Windows, and Linux. Some of the benefits of using Lens include:
- Confidence that your clusters are properly setup and configured.
- Increased visibility, real time statistics, log streams, and hands-on troubleshooting capabilities.
- The ability to work with your clusters quickly and easily, radically improving productivity and the speed of business.
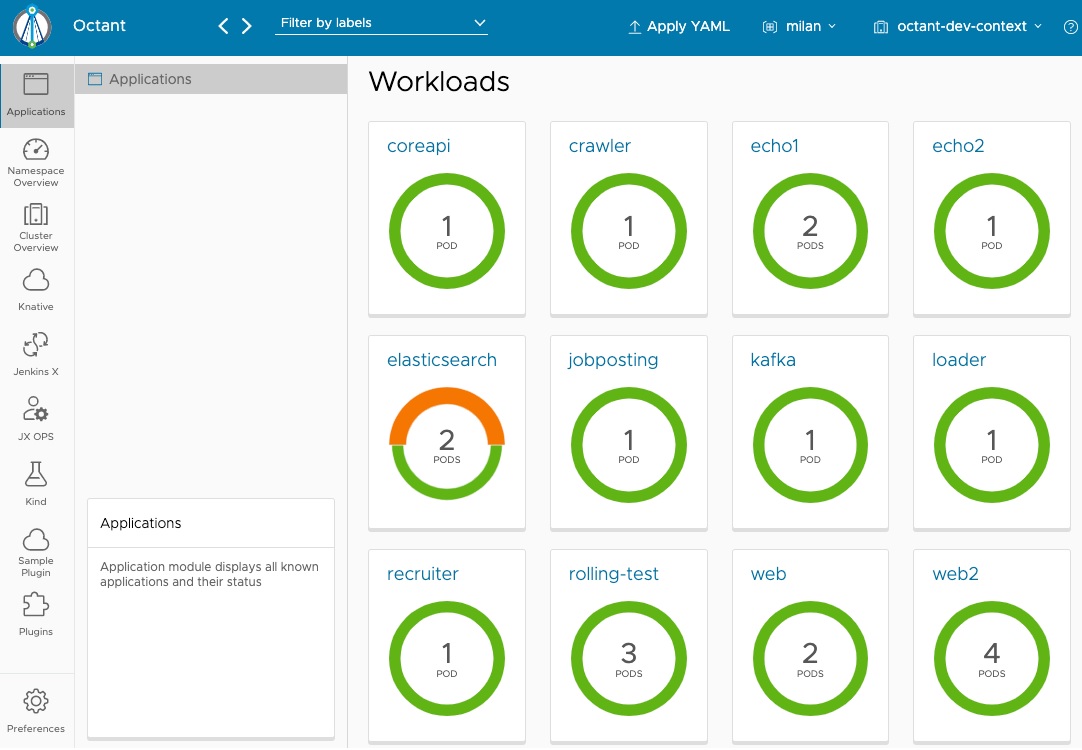
Octant
Octant is an open source developer-centric web interface for Kubernetes that lets you inspect a Kubernetes cluster and its applications.
Visualization
Provide a visual interface to managing Kubernetes that complements and extends existing tools like kubectl and kustomize.
Extensibility
Add information to your cluster views through Octant’s plug-in system.
Versatility
Support a variety of debugging features such as filtering labels and streaming container logs to be part of the Kubernetes development toolkit.
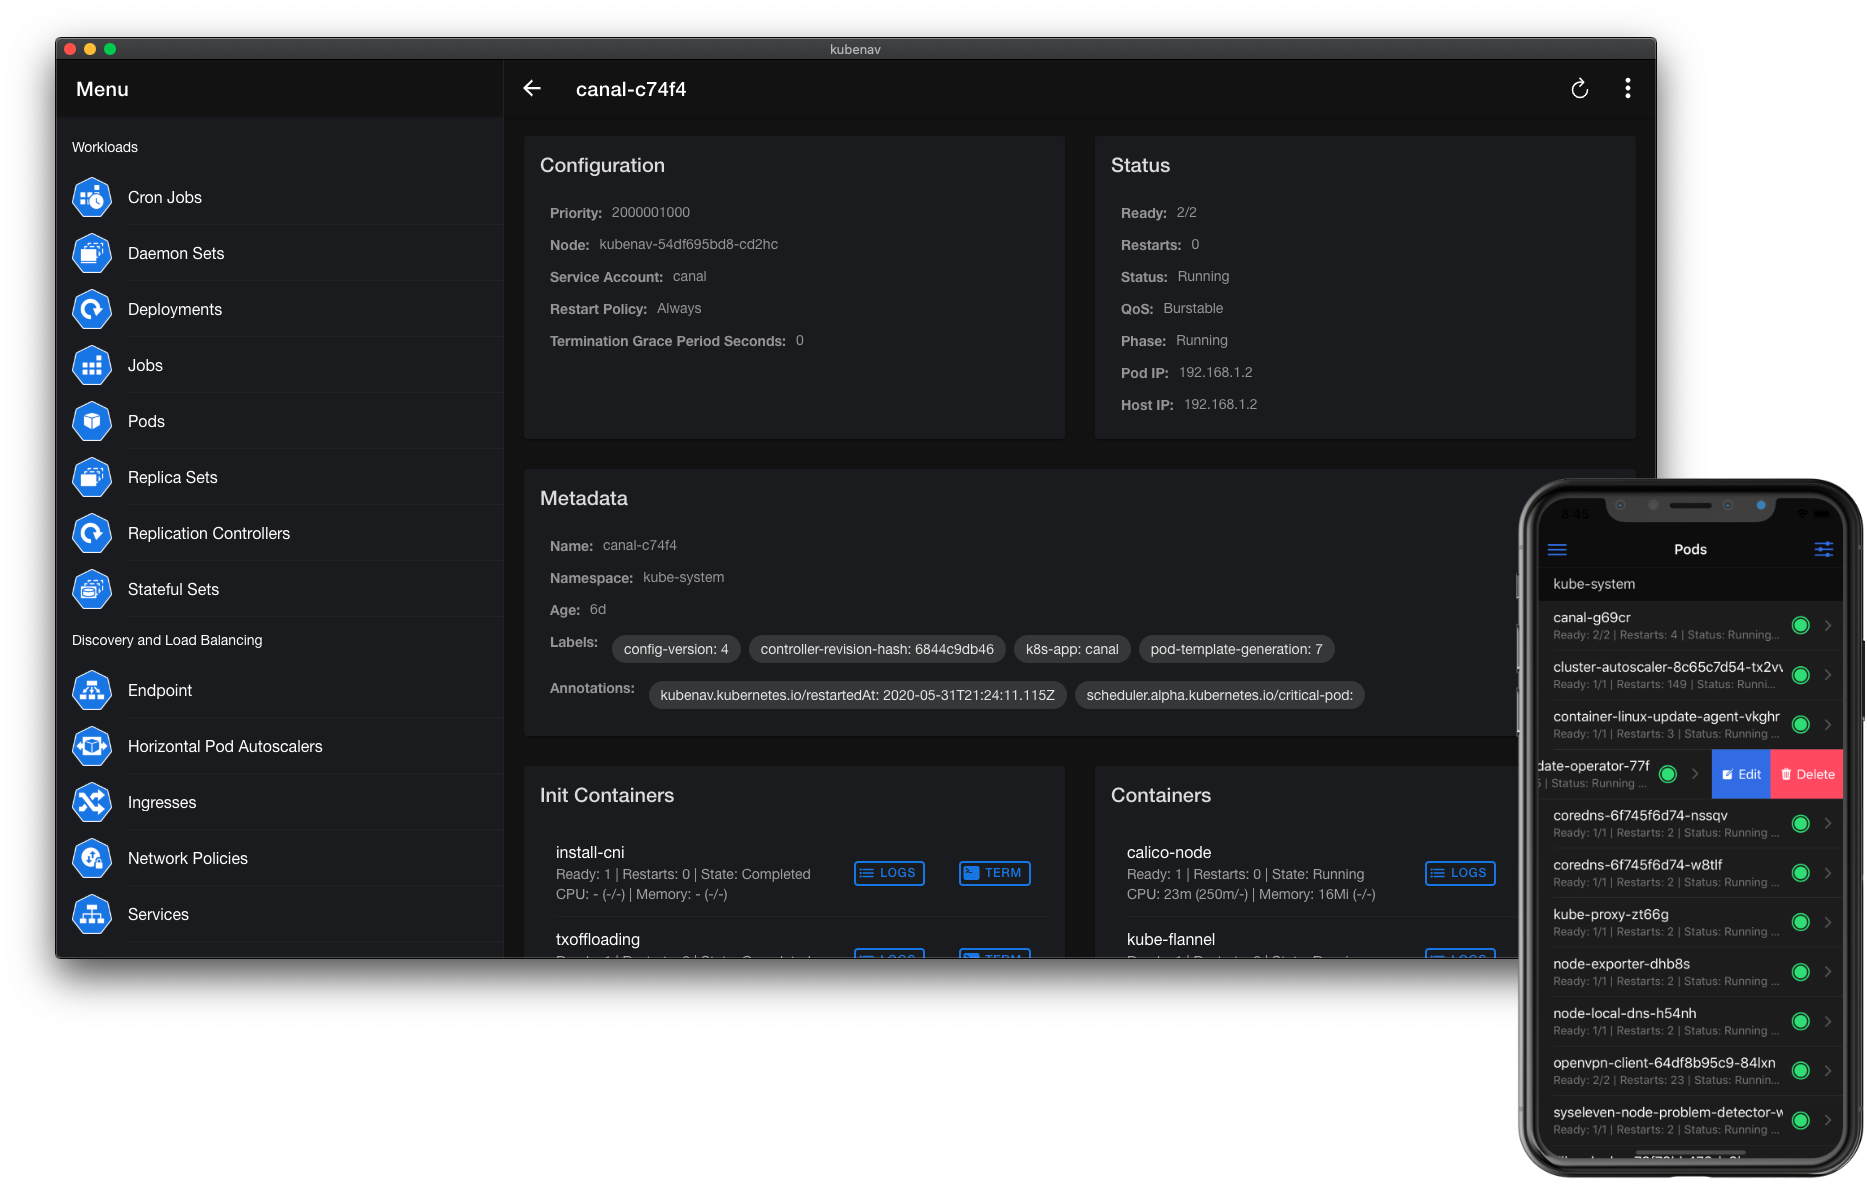
Kubenav
- Available for mobile, desktop and web: kubenav provides the same experience for mobile, desktop and web, with nearly 100% code sharing.
- Manage Resources: All major resources like Deployments, StatefulSets, DaemonSets, Pods, etc. are supported.
- Custom Resource Definitions: View all Custom Resource Definitions and mange Custom Resources.
- Modify Resources: Edit and delete all available resources or scale your Deployments, StatefulSets, DaemonSets.
- Filter and Search: Filter the resources by Namespace and find them by their name.
- Status Information: Fast overview of the status of workloads and detailed information including Events.
- Resource Usage: View the requests, limits and current usage of Pods and Containers.
- Logs: View the logs of a container or stream the logs in realtime.
- Terminal: Get a shell into a container, right from your phone.
- Manage multiple Clusters: Add multiple clusters via kubeconfig or your preferred Cloud Provider, including Google, AWS and Azure.
- Port-Forwarding: Create a port-forwarding connection to one of your Pods and open the served page in your browser.
- Prometheus Integration: kubenav allows you to view your Prometheus metrics directly in the dashboard and to build your own dashboards via the Prometheus plugin.
- Elasticsearch Integration: Discover your logs with the Elasticsearch plugin.
- Jaeger Integration: Analyze your traces with the Jaeger plugin.
Kubernetes Dashboard
Deploy dashboard
$ kubectl apply -f https://raw.githubusercontent.com/kubernetes/dashboard/v2.3.1/aio/deploy/recommended.yaml
Read the bearer token
$ kubectl -n kubernetes-dashboard describe secret
Run the proxy
$ kubectl proxy
Kubectl will make Dashboard available at:
http://localhost:8001/api/v1/namespaces/kubernetes-dashboard/services/https:kubernetes-dashboard:/proxy/
https://github.com/kubenav/kubenav